Historical portfolio replay
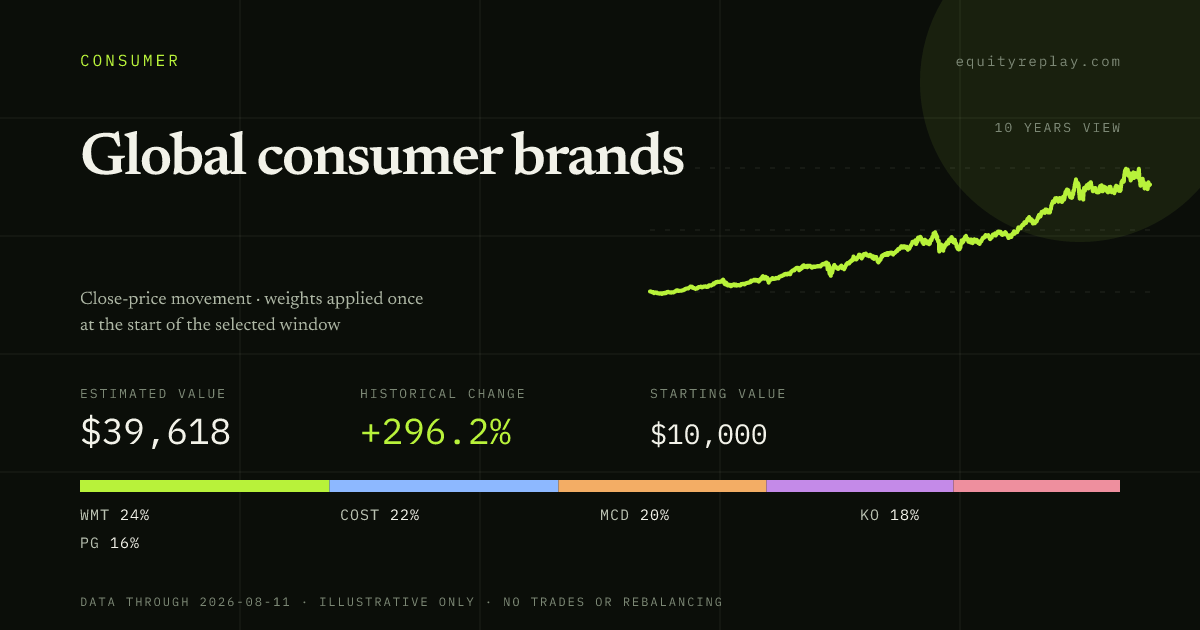
Global consumer brands: 10 years replay
A recognizable group of retailers, restaurants, household brands, and consumer staples for a familiar historical comparison.
Historical close-price movement · weights applied once at the start · no trades or rebalancing.
Historical result
What $10,000 would have become
- Estimated value
- $40,109
- Historical change
- +301.1%
- Data through
- Sep 25, 2026
Allocation
Global consumer brands holdings
| Ticker | Company | Weight |
|---|---|---|
| WMT | Walmart | 24% |
| COST | Costco | 22% |
| MCD | McDonald's | 20% |
| KO | Coca-Cola | 18% |
| PG | Procter & Gamble | 16% |
Method
How this historical replay works
Each allocation weight is applied once at the beginning of the selected window. The result is a close-price illustration—not a brokerage record, trade history, rebalancing plan, recommendation, or projection.
Historical windows