Historical portfolio replay
Mega-cap compounders: 1 month replay
A familiar group of global businesses with a bias toward scale, cash flow, and staying power.
Historical close-price movement · weights applied once at the start · no trades or rebalancing.
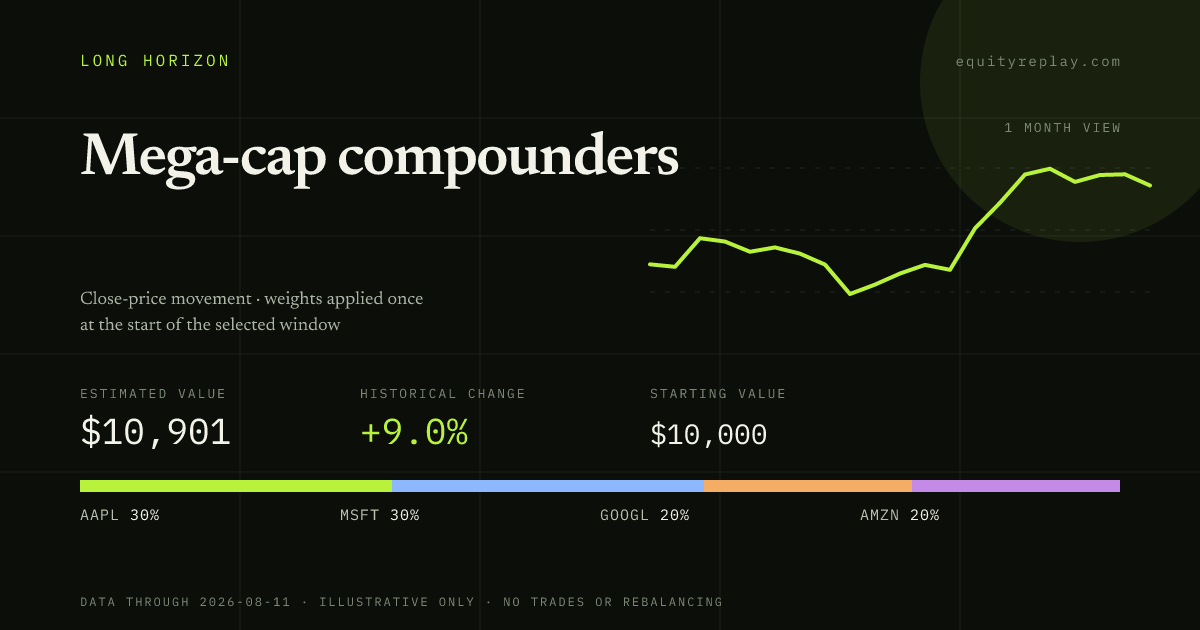
Historical result
Replay the allocation in the app
The interactive replay calculates the available close-price history for each holding and shows the result when the data is available for the selected window.
Allocation
Mega-cap compounders holdings
| Ticker | Company | Weight |
|---|---|---|
| AAPL | Apple | 30% |
| MSFT | Microsoft | 30% |
| GOOGL | Alphabet | 20% |
| AMZN | Amazon | 20% |
Method
How this historical replay works
Each allocation weight is applied once at the beginning of the selected window. The result is a close-price illustration—not a brokerage record, trade history, rebalancing plan, recommendation, or projection.
Historical windows