Historical portfolio replay
The innovators: 1 year replay
A high-conviction basket for exploring what a more innovation-led allocation might have looked like.
Historical close-price movement · weights applied once at the start · no trades or rebalancing.
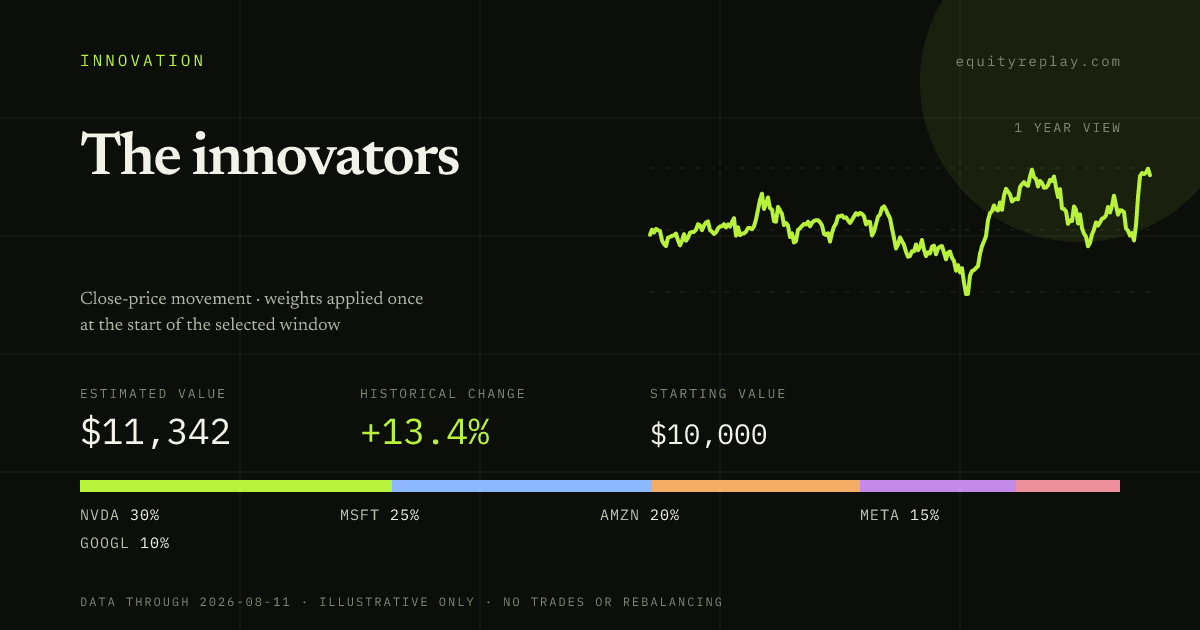
Historical result
What $10,000 would have become
- Estimated value
- $11,539
- Historical change
- +15.4%
- Data through
- Sep 25, 2026
Allocation
The innovators holdings
| Ticker | Company | Weight |
|---|---|---|
| NVDA | NVIDIA | 30% |
| MSFT | Microsoft | 25% |
| AMZN | Amazon | 20% |
| META | Meta Platforms | 15% |
| GOOGL | Alphabet | 10% |
Method
How this historical replay works
Each allocation weight is applied once at the beginning of the selected window. The result is a close-price illustration—not a brokerage record, trade history, rebalancing plan, recommendation, or projection.
Historical windows